


by Jay Richardson, Broker - The Richardson Team
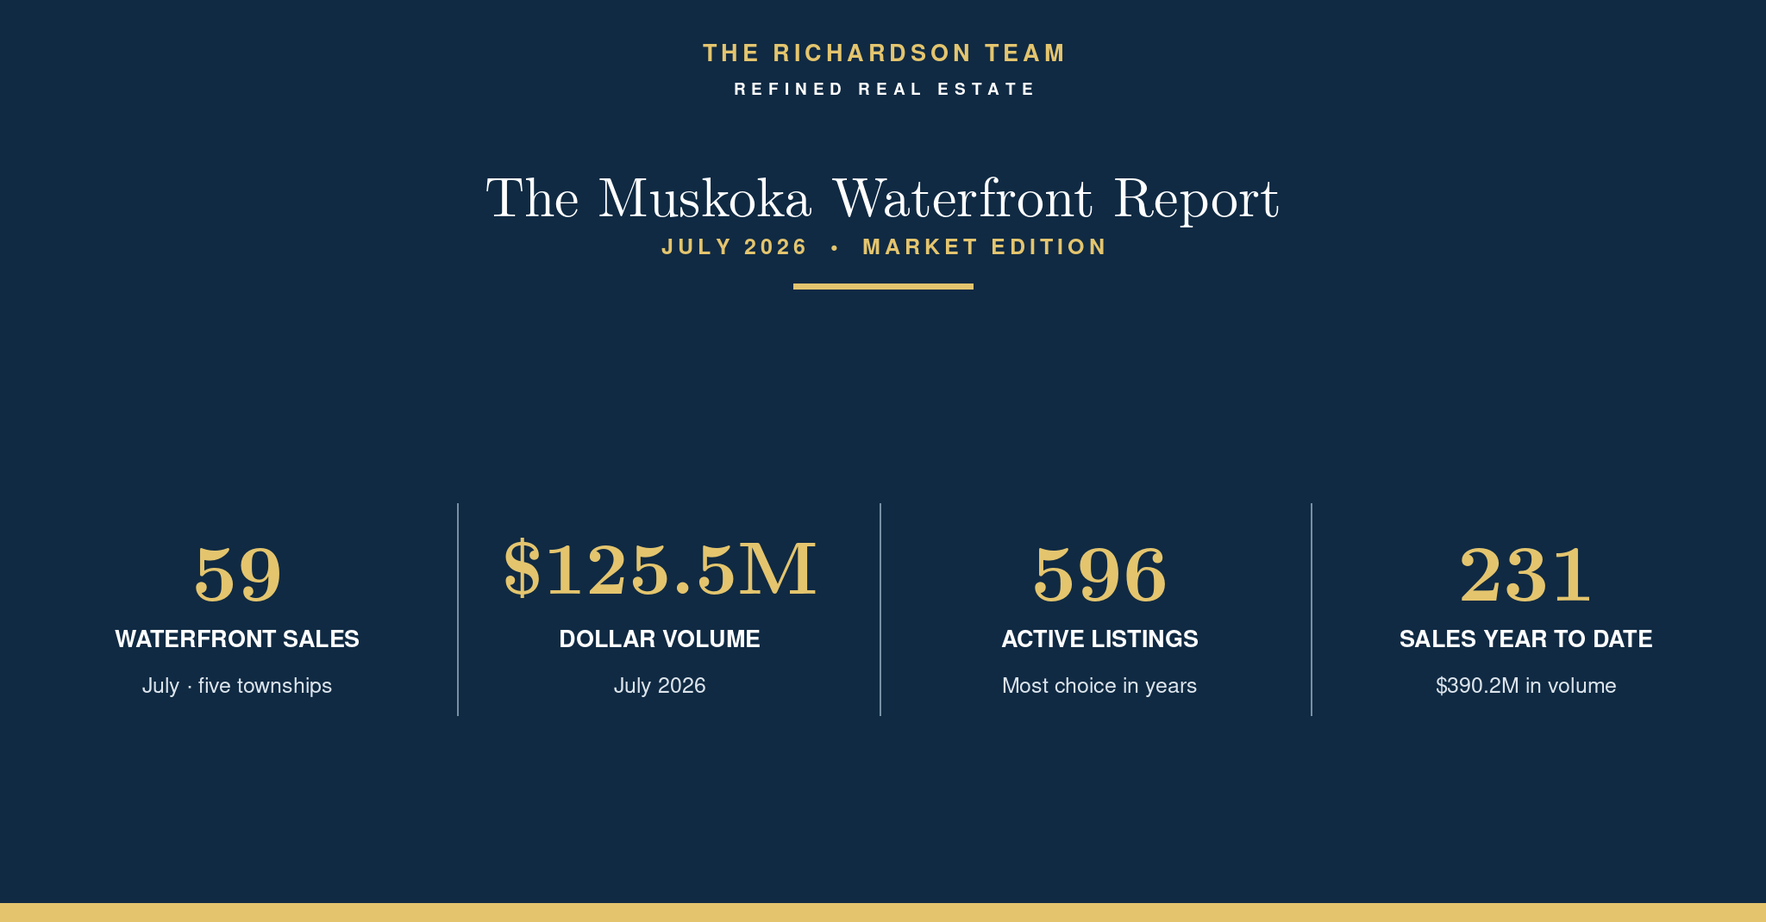
The Month at a Glance
A market with more listings, but decisive activity at the top
July brought 59 waterfront sales across our five townships — Muskoka Lakes, Huntsville, Gravenhurst, Bracebridge and Lake of Bays — worth just over $125 million. Buyers had 596 active waterfront listings to consider, yet the month’s strongest results show that well-positioned properties can still command serious attention.
Muskoka Lakes accounted for nearly two-thirds of the region’s July dollar volume, while Bracebridge posted a sharp increase in dollar volume and Gravenhurst continued to build year-to-date momentum. Lake of Bays and Huntsville were quieter, with substantial inventory giving buyers more time and leverage.
The first seven months of 2026 now stand at 231 waterfront sales worth roughly $390 million. As always, the regional total is only the beginning of the story: each township is moving at a distinctly different pace.
• 59 waterfront sales in July across the five townships
• $125.5M in dollar volume for July 2026
• 596 active listings across the region
• 231 sales year to date, worth approximately $390.2M
Jay’s Take
July’s verdict in one line: buyers have abundant choice, but premium properties priced to the market are still commanding premium results. Nearly $125.5 million in waterfront changed hands, including four sales between $5.735 million and $10 million. At the same time, inventory reached 596 active listings and ranged from 6.4 months in Muskoka Lakes to more than 18 months in Huntsville and Lake of Bays.That gap matters. Muskoka is not behaving like one market, and neither buyers nor sellers should rely on a regional headline alone. The right pricing and negotiating strategy depends on the lake, location, price range and competition surrounding the individual property.
Around the Lakes
Five townships, five stories
Muskoka Lakes — median $2,300,00027 sales · 174 active · 6.4 months of inventory · 95.4% of list · 28 days on market
Year to date: 89 sales · $200.9M volume · median $1,395,000
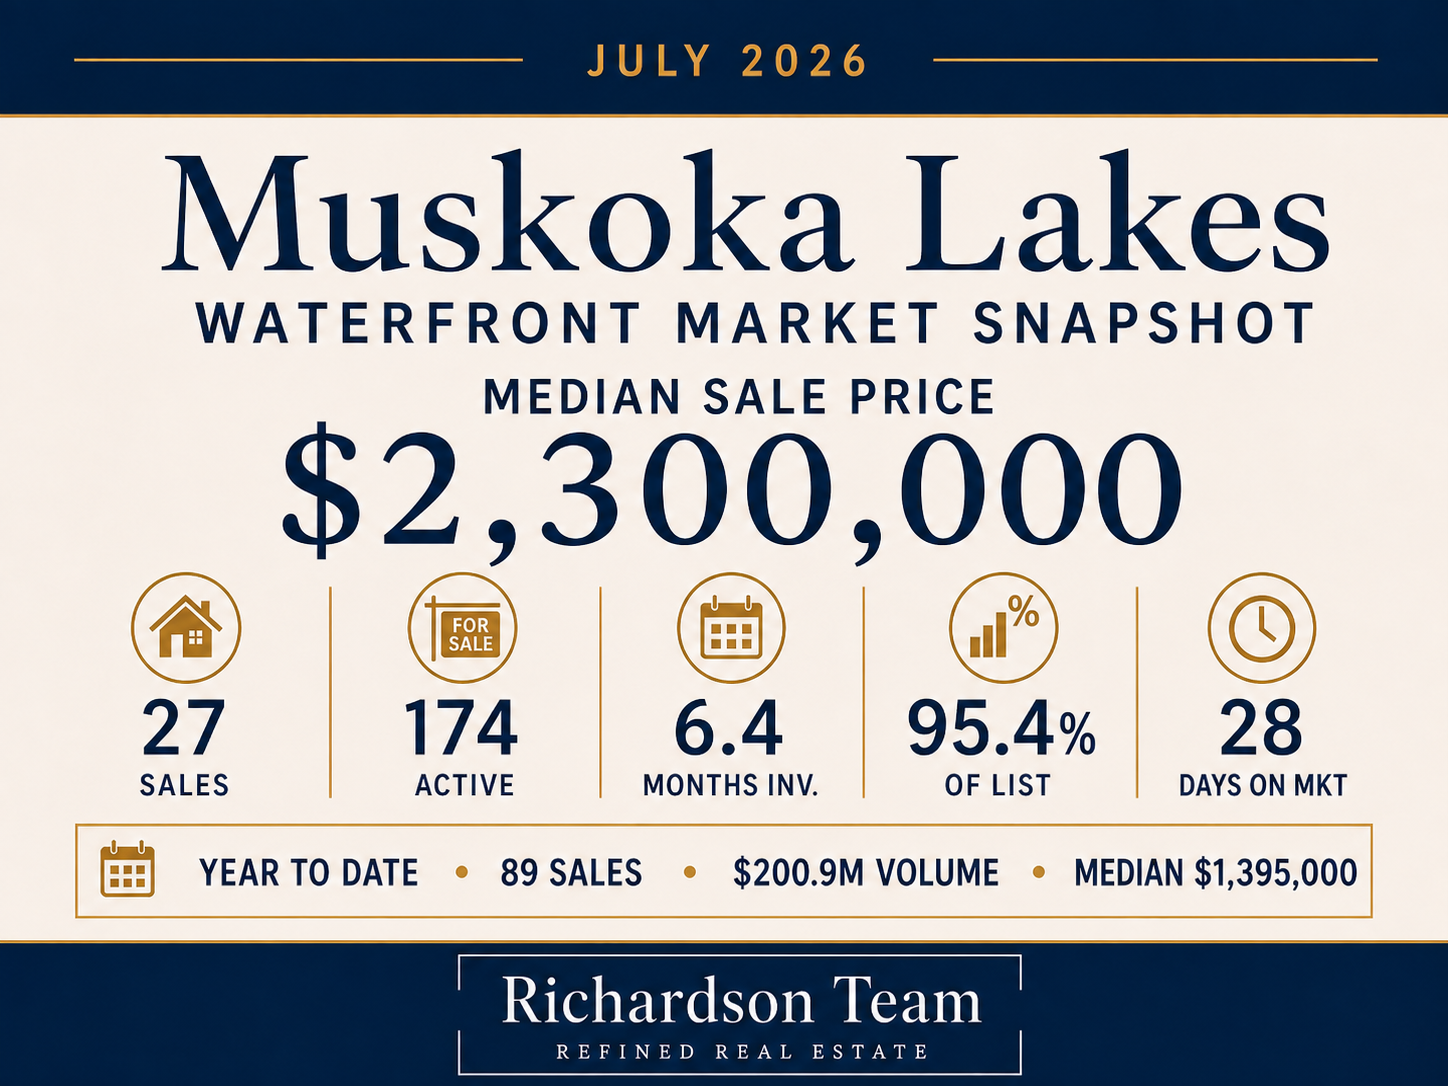
Muskoka Lakes drove the regional market in July with 27 sales and $78.2 million in dollar volume. Sales edged 3.8% ahead of last July, while dollar volume rose 24.6% and the median climbed 54.6% to $2.3 million. The month’s top waterfront sale closed here at $10 million, and three of the region’s four highest sales were in Muskoka Lakes.
At 6.4 months of inventory, Muskoka Lakes carried the tightest supply of the five townships. The year-to-date numbers are more restrained — sales were down 2.2%, dollar volume was down 18.3% and the median was down 17.9% — which reinforces how strongly a handful of premium July transactions shaped the month’s results.
Huntsville — median $929,204
7 sales · 130 active · 18.6 months of inventory · 94.5% of list · 35 days on market
Year to date: 39 sales · $44.4M volume · median $810,000
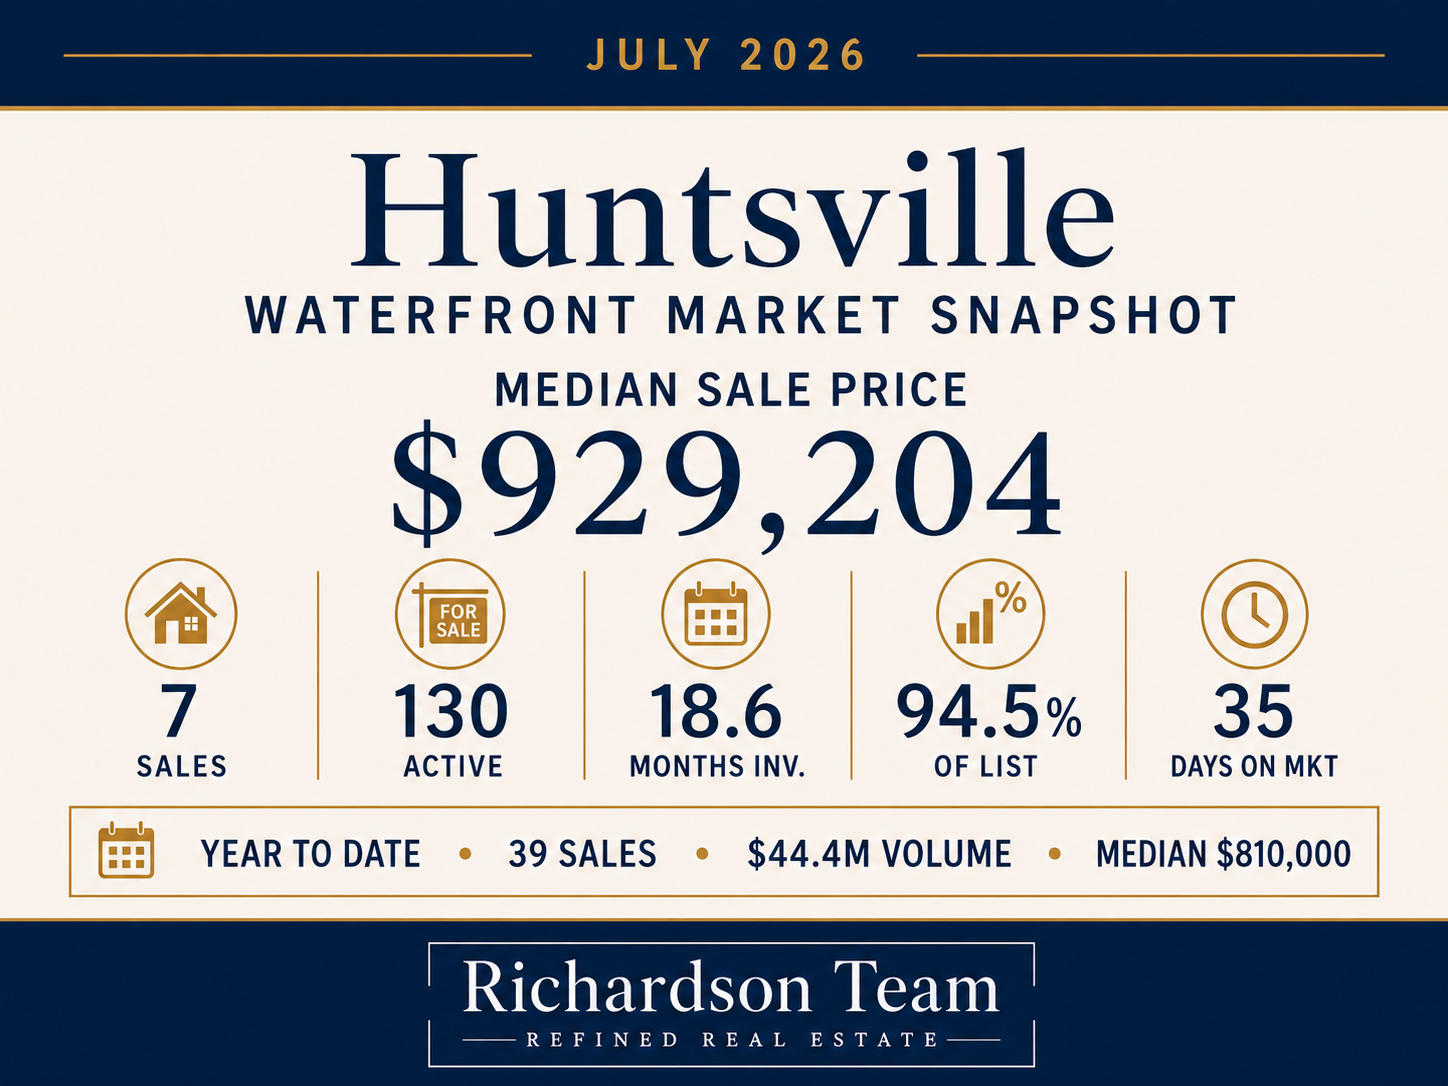
Huntsville had a quieter July, with seven waterfront sales worth $6.8 million. Sales declined 22.2% from last July and dollar volume fell 43.5%, although the median rose 19.1% to $929,204. With 130 active listings and 18.6 months of inventory, buyers have meaningful selection and room to compare properties carefully.
Year to date, Huntsville recorded 39 sales worth $44.4 million. Both sales and dollar volume remain below last year, while the $810,000 year-to-date median is down 8.5%. The numbers point to a selective market in which presentation, condition and accurate pricing are doing much of the work.
Gravenhurst — median $925,000
9 sales · 113 active · 12.6 months of inventory · 96.8% of list · 23 days on market
Year to date: 37 sales · $52.7M volume · median $1,195,000
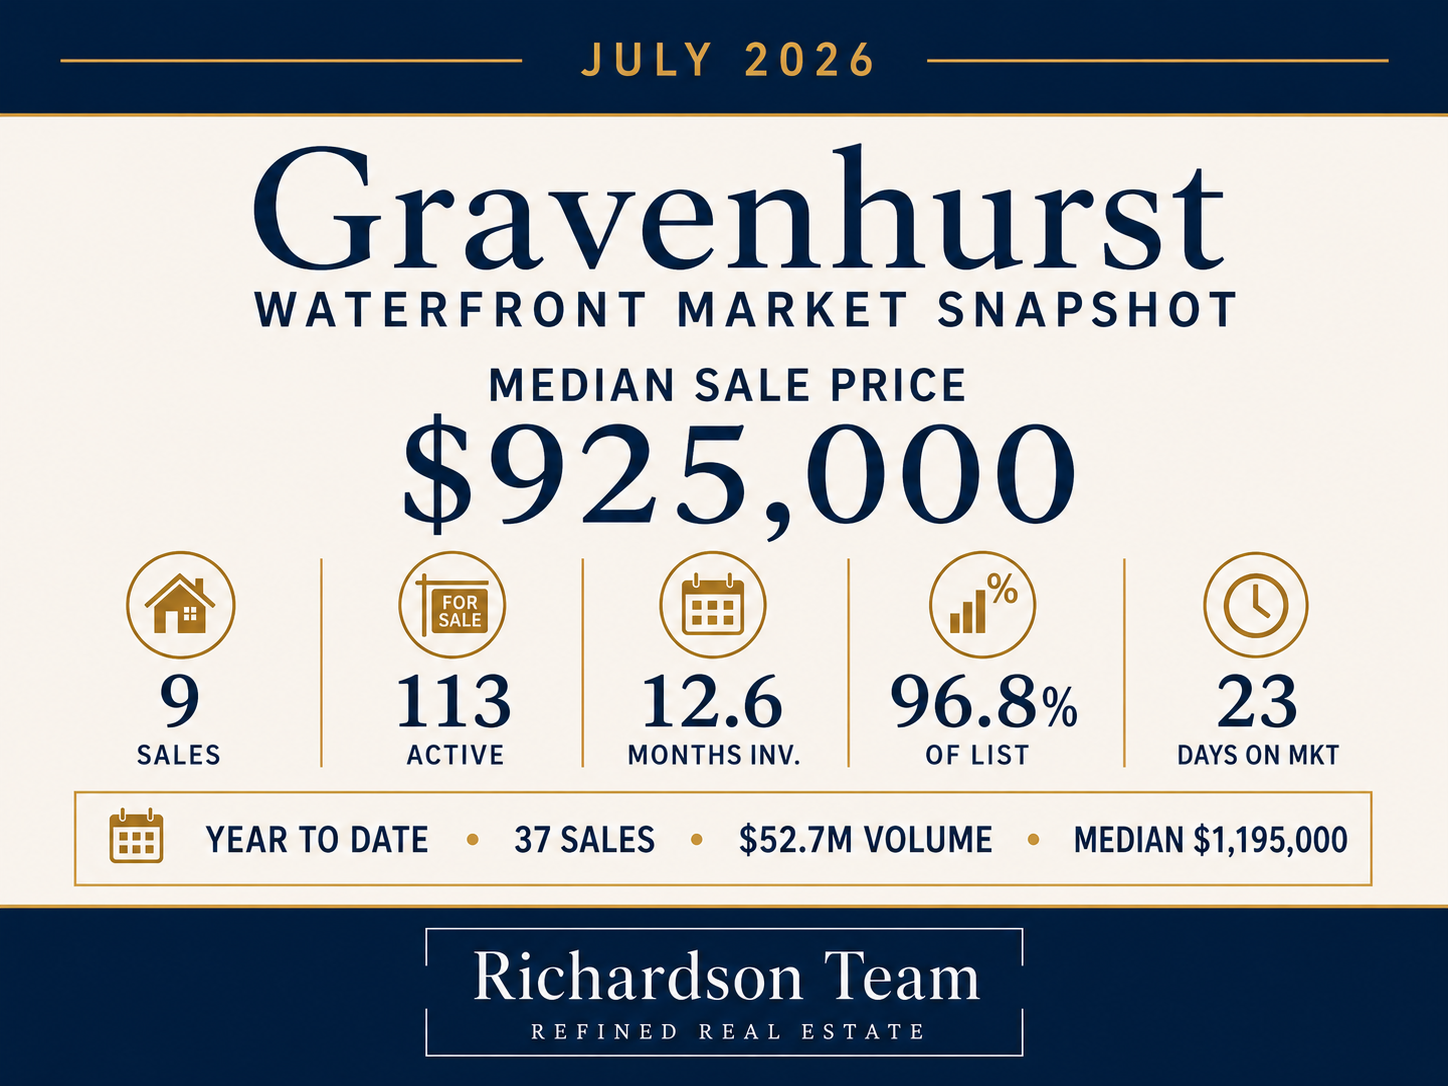
Gravenhurst recorded nine waterfront sales in July, up 12.5% from last year. Dollar volume declined 21.7% and the monthly median fell 32.8% to $925,000, reflecting a different mix of properties sold. Sellers achieved 96.8% of asking — the strongest ratio in the region — and sold in a median of 23 days.
The year-to-date picture is stronger: 37 sales, up 19.4%, and $52.7 million in volume, up 17%. With 113 active listings and 12.6 months of inventory in July, buyers still have considerable choice, but properly positioned properties continue to find their market.
Bracebridge — median $987,500
10 sales · 71 active · 7.1 months of inventory · 95.2% of list · 21 days on market
Year to date: 32 sales · $47.4M volume · median $862,500
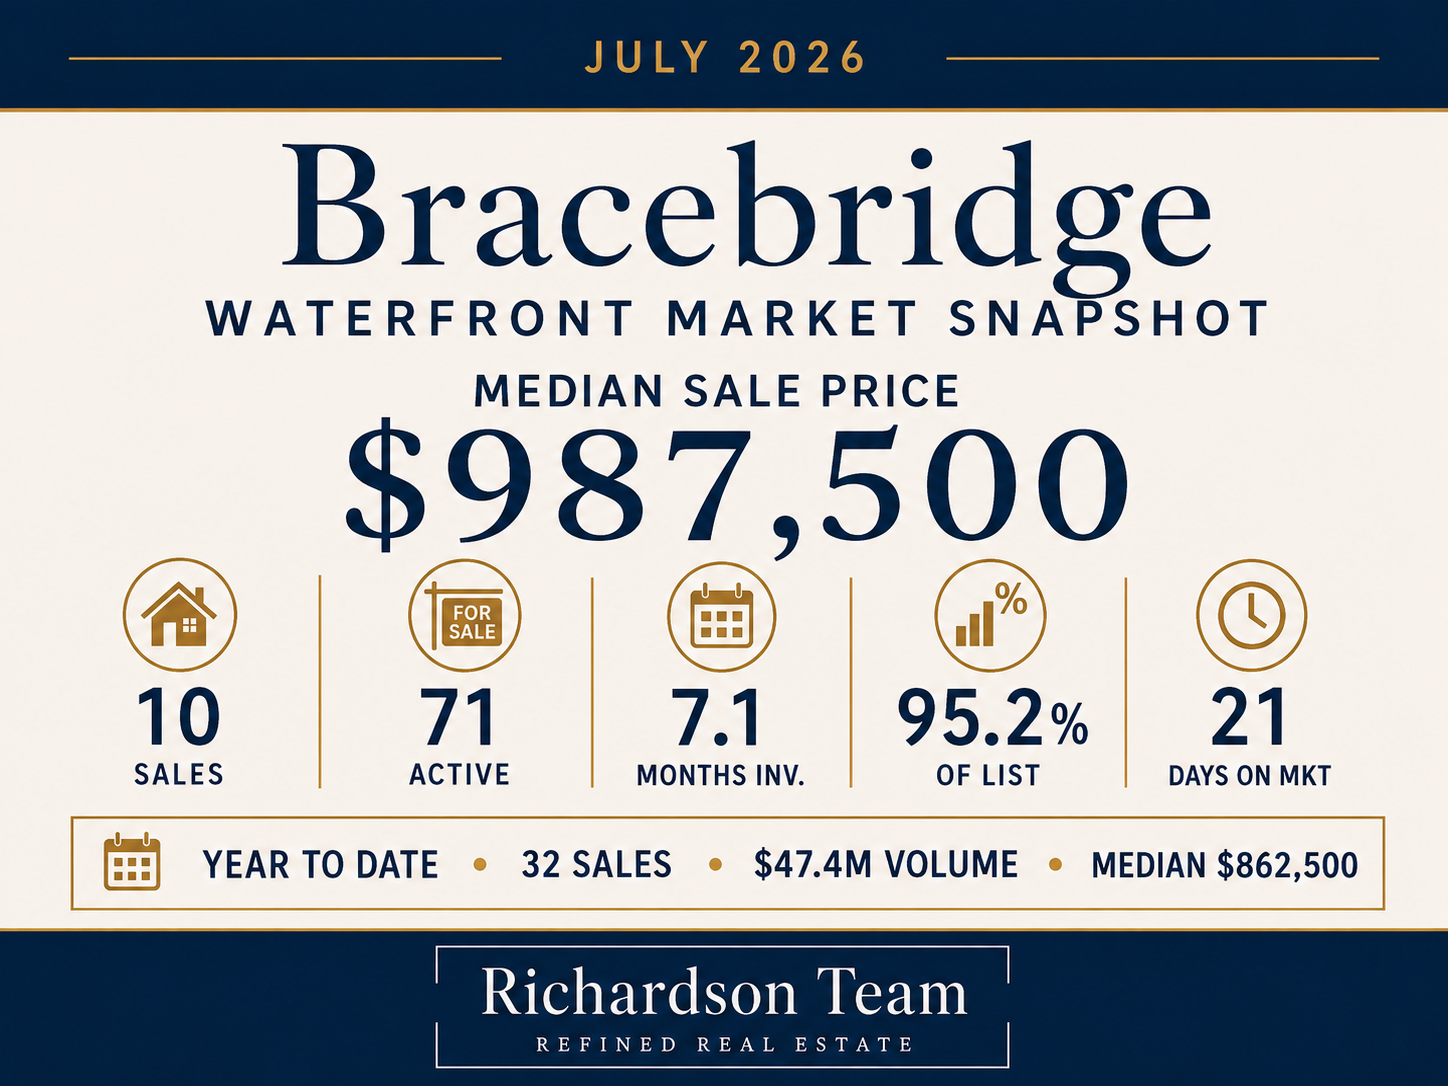
Bracebridge produced one of July’s most notable results. Although the number of sales declined 16.7% to ten, dollar volume rose 61.1% to $19.7 million and the median increased 19.3% to $987,500. A $6.3 million waterfront sale helped lift the month, while properties sold in a median of 21 days.
Year to date, Bracebridge recorded 32 sales worth $47.4 million. Dollar volume was up 58.1% and the median rose 9.9% to $862,500. With 7.1 months of inventory, Bracebridge remained one of the more balanced waterfront markets in the region.
Lake of Bays — median $1,070,000
6 sales · 108 active · 18.0 months of inventory · 96.3% of list · 51.5 days on market
Year to date: 34 sales · $44.7M volume · median $1,001,500
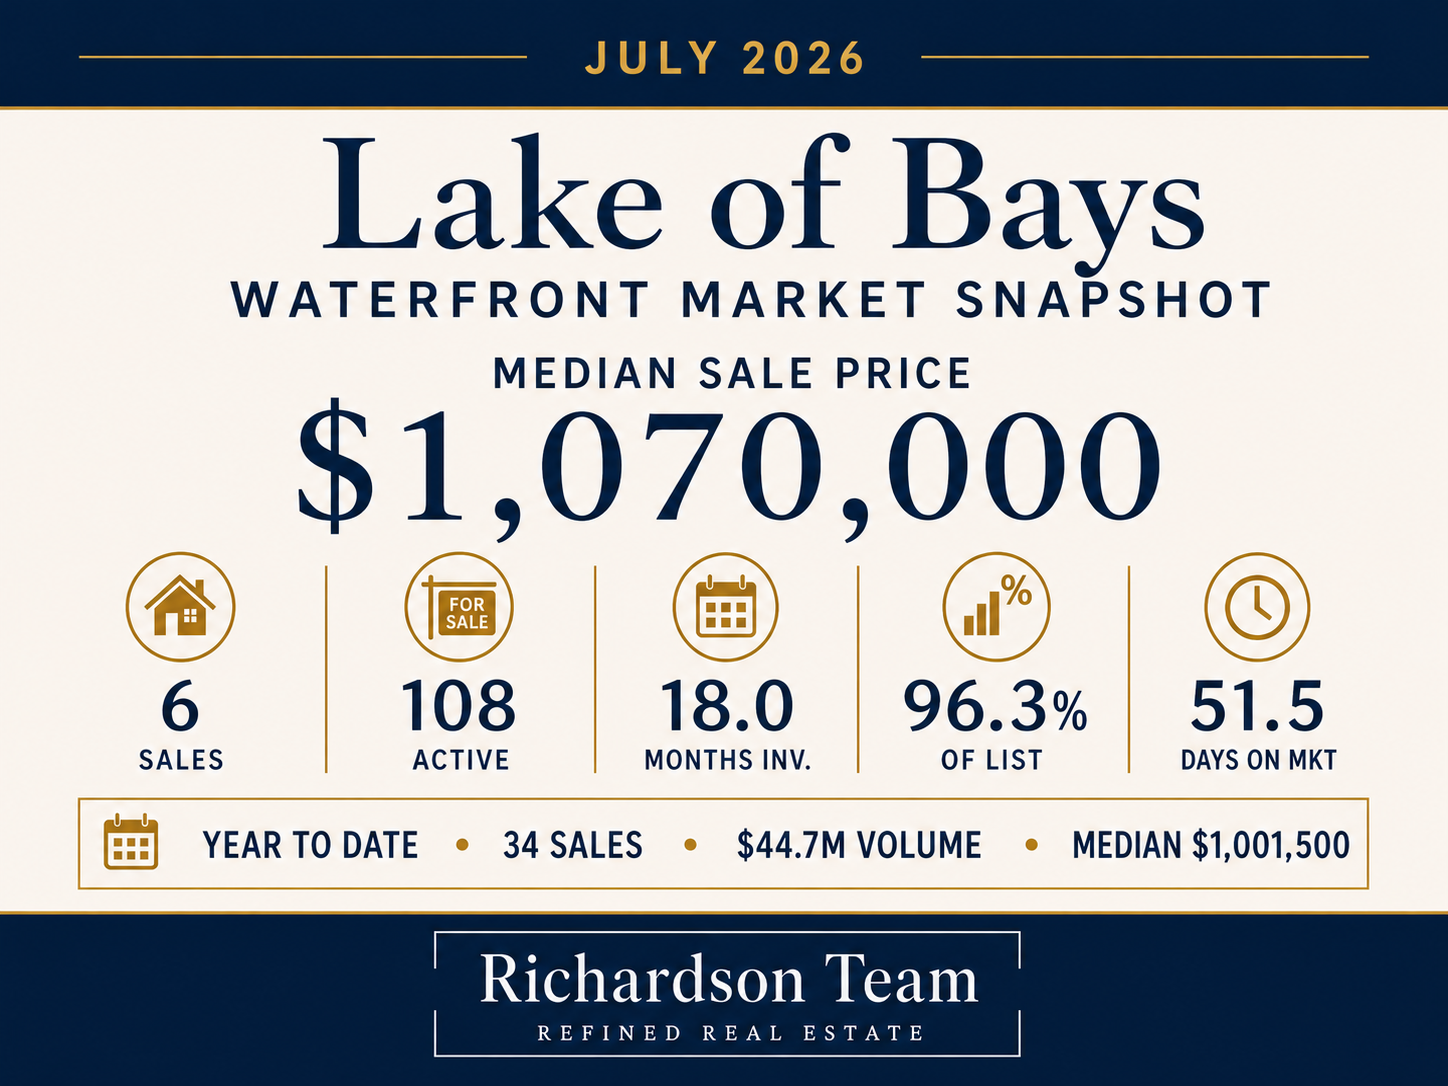
Our home waters had a patient July, with six sales against 108 active listings. Sales were down 45.5% from last July and dollar volume declined 24.1%, but the median rose 7% to $1,070,000. Sellers achieved 96.3% of asking, although the median time on market extended to 51.5 days.
The year-to-date story remains positive: 34 sales, up 3%, with dollar volume up 11.3% to $44.7 million and the median up 7.1% to $1,001,500. Lake of Bays buyers have more selection and more time, but the year-to-date gains show that demand remains present for properties that offer the right combination of shoreline, privacy, condition and value.
The High End
Top waterfront sales in July 2026.
The premium end of the market made a clear statement in July. The month’s largest waterfront sale closed at $10 million, and four properties sold between $5.735 million and $10 million. Three of those four sales were in Muskoka Lakes, while Bracebridge contributed a $6.3 million transaction.
• Muskoka Lakes — listed at $10,550,000 · sold for $10,000,000 · 94.8% of list
• Muskoka Lakes — listed at $6,995,000 · sold for $6,750,000 · 96.5% of list
• Bracebridge — listed at $6,495,000 · sold for $6,300,000 · 97.0% of list
• Muskoka Lakes — listed at $5,985,000 · sold for $5,735,000 · 95.8% of list
What this means if you are buying
With 596 waterfront listings across the region, buyers have real selection. In Huntsville and Lake of Bays, months of inventory exceeded 18, giving buyers time to compare shorelines, exposures, condition and value. However, the high-end results are an important reminder that outstanding properties can still attract decisive buyers and sell within a few points of asking.The best approach is to be patient about the property but prepared for the offer. Have your financing and due diligence plan organized so you can act confidently when the right cottage appears.
What this means if you are selling
July confirms that buyers will pay for the right property, but they have enough choice to reject anything that feels mispriced. Sale-to-list ratios ranged from 94.5% to 96.8% across the five townships, showing that properties are selling reasonably close to asking once the market accepts the price.In a region carrying nearly 600 waterfront listings, pricing correctly from the beginning is essential. Strong presentation, strategic positioning and marketing beyond Muskoka remain the best ways to distinguish a property from its competition.
If you are considering a sale this season, the sooner we talk about positioning, the stronger your opportunity to stand out.
Every lake in Muskoka tells its own story, and the numbers only ever tell half of it. If you would like to know what this month’s market means for your cottage — or the one you are dreaming about — I am always happy to talk it through.
Data: Canadian Real Estate Association · OnePoint Association of REALTORS®. MLS® Waterfront Market Activity, July 2026. Statistics reflect detached waterfront sales.